
🌡️
Températures plus élevées en ville
Les îlots de chaleur font en sorte que les villes sont plus chaudes que les zones rurales voisines, notamment la nuit.
Watchlist

Executive summary of the child care center analysis
A value close to 0% is preferable.
A high value, close to 35%, is good.
Annual PM2.5 average (2025)
INSPQ territorial index · 2021
Bienvenue à la page dédiée au centre de la petite enfance CENTRE DE LA PETITE ENFANCE LA DÉCOUVERTE. Découvrez une analyse de la canopée, des îlots de chaleur et des sources de pollution industrielle situées à proximité.
Cette analyse met en lumière des pistes d’action concrètes pour mieux protéger les tout-petits : verdissement, plantation d’arbres et aménagement d’espaces plus frais. Accéder directement à une analyse environnementale pour le CPE :


L'image présente, en vert, les arbres détectés par analyse satellitaire. Ces arbres contribuent à la santé du quartier.
Excellent: your tree cover meets the City of Quebec’s 35% objective. Preserve mature trees and continue planting to maintain this vegetation cover.

L'image présente en rouge et orange les sections du terrain plus chaudes et contribuent aux îlots de chaleur.
Faible contribution : vos surfaces limitent bien les îlots de chaleur. Continuez à favoriser les arbres, les zones ombragées et les revêtements perméables.
Québec - Henri-IV · Québec
10,7 µg/m³
Annual PM2.5 average (2025)
5,5 km
straight-line distance
Guideline exceeded : the annual average of fine particles at the nearest government station is above the WHO annual guideline value (5 µg/m³)
The annual average exceeds 5 µg/m³. Follow daily data and reduce local sources, including vehicle idling near the centre.
This station indicates air quality in the area; it does not measure air directly on the centre's grounds.
The WHO guideline value is a health reference. During short-term episodes, consult recent measurements and use well-filtered indoor air whenever possible.
There is no completely safe exposure to fine particles.
Source: Quebec Air Quality Monitoring Network (RSQAQ), continuous hourly data. The green line represents the WHO annual guideline value (5 µg/m³).
This facility reported fine-particle (PM2.5) air releases in its 2023 NPRI report.
Reducing one tonne of emissions can result in savings of $340,000 to $520,000 in health-related costs and their societal consequences. Source: Health Canada (2022)
This reported quantity does not represent the concentration breathed at the early childhood centre. Distance, wind, stack height, and other sources affect exposure.
1,123 m
Distance to highway
51 000
vehicles per day
Bretelle Lebourgneuf dir. est vers Robert-Bourassa dir. sud
This is the straight-line distance to the nearest highway segment. Plan a dense buffer of trees and shrubs between the CPE and the highway: it can help reduce noise, capture some pollutants, and provide a more comfortable environment.
The following data describe the CLSC territory of Duberger - Les Saules - Lebourgneuf where the child care center is located. They describe the territory’s population, not the children attending this center.
8,2 %
Asthma prevalence
among ages 1–12
+1,4 pt
Difference from Quebec (points)
6,8 %
Quebec average
14,5 / 1 000
Incidence · new cases / 1,000
Prevalence above the Quebec average
Duberger - Les Saules - Lebourgneuf: 8,2%, or 1,4 percentage point above Quebec (6,8%).
Quebec is the reference, with a prevalence of 6.8%. These data describe respiratory health among the population in this territory. They cannot establish that a child care center or its environment is responsible for observed asthma cases.
Difference: +1,4 point
Data from 2022-2023. Source: CIUSSS de la Capitale-Nationale.
La défavorisation matérielle est un indicateur territorial calculé à partir des données du recensement sur la scolarité, l’emploi et le revenu. Le quintile 1 regroupe les secteurs les plus favorisés au Québec; le quintile 5, les plus défavorisés.
Position du secteur sur l’échelle québécoise
Très favorisé
Favorisé
Moyennement favorisé
Défavorisé
Très défavorisé
1 / 5
Très favorisé
Cet indice décrit le secteur où se situe le CPE, et non la situation socio-économique des enfants ou des familles qui le fréquentent.
Source : Institut national de santé publique du Québec (INSPQ), Indice de défavorisation du Québec 2021, dimension matérielle. Consulter la source.
Why write to your Member of the National Assembly?
Write to:

Les établissements éducatifs, y compris les CPE, peuvent déposer une demande d’ici le 6 octobre.
La Fondation Monique-Fitz-Back finance et soutient des initiatives qui stimulent le pouvoir d’agir des jeunes du Québec et renforcent leur connexion à la nature et à leur communauté. Elle octroie chaque année des subventions pour appuyer des projets environnementaux et sociaux.
Share of the ground surface shaded by treetops (public and private) in an urban area. The higher the index, the more trees there are in the area.
Phenomenon where urban environments are warmer than neighboring rural areas, due to mineralization (asphalt, concrete), waterproofing, low albedo, urban morphology and anthropogenic heat.
An urban area that remains significantly cooler (especially thanks to trees, green spaces and shade), providing thermal refuge during heat waves.
The assessment of the urban canopy and the identification of heat and cool islands were carried out systematically in batches, using official data provided by the Institut national de santé publique du Québec (INSPQ) and the City of Quebec.
The available geospatial data made it possible to measure the proportion of tree cover (canopy) and to map areas with significant thermal differences. The treatments were applied uniformly across the entire territory to ensure comparability of results between sectors. This batch approach automated processing, ensured methodological consistency, and facilitated the production of comparable maps and indicators. The results provide an integrated view of canopy distribution and urban thermal phenomena at the city scale. Reference years differ by dataset. Territorial health and deprivation indicators do not describe children attending the CPE. The nearest air-quality station does not necessarily measure exposure at the CPE itself.
Sources :
Use the following citation to share or reuse this analysis.
« Centre de la petite enfance la découverte : CPE environmental analysis » , RevolvAir, accessed on 8 October 2026.
Analyzed page : https://pollution.revolvair.org/en/cpe/ca/qc/quebec/centre-de-la-petite-enfance-la-decouverte
RevolvAir project : https://revolvair.org
Important notice
This analysis is provided for information purposes, based on available data and to the best of our knowledge. It does not replace professional expertise and cannot establish a cause-and-effect relationship between the CPE environment and children's health. Its purpose is to help CPEs and their partners identify opportunities for a healthier, more comfortable environment that better protects young children.
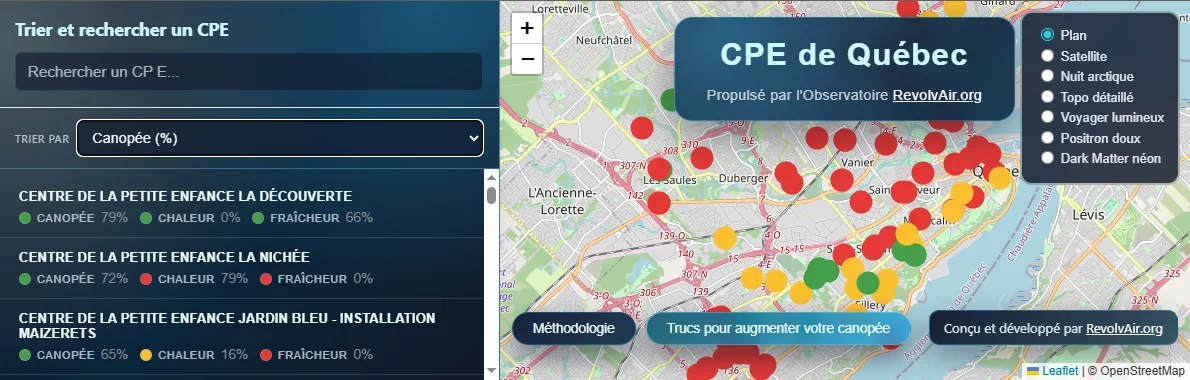
Is your child care center or municipality not yet included in the analysis? Contact us to share your interest and discuss future assessments.
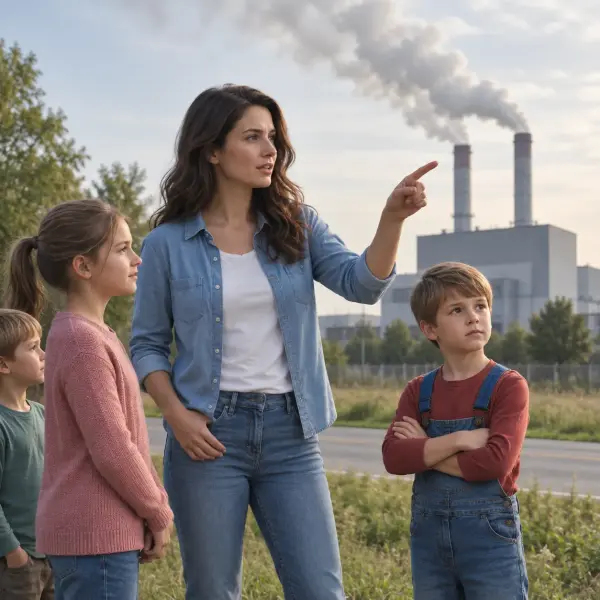
Participate in our citizen science project by adding sources of air pollution near you. This project will allow us to create an accurate map and provide you with more precise analyses of air pollution issues. Thank you for your participation!
Yes, I want to participate
Our air quality analysis station will allow you to know the quality of the air you and your family breathe in real time. You will also produce open scientific data for scientists and society to use, helping us fight for our right to clean air. Made in Québec!
Learn more