
Québec - CANAM Ponts Canada inc.
Québec, Québec
Website Link
Data from the National Pollutant Release Inventory (NPRI) is provided by the industries themselves. It is important to note that the methods of declaration used may potentially underestimate pollutant emissions.
Benefit per ton of PM 2.5 reduced
Improving the health of citizens by reducing fine particulate matter

214 200$

By reducing its emissions of fine particulate matter (PM 2.5), this industry could decrease the costs related to health problems caused by fine particles. For the year 2023 only, this potential is estimated at 214 200$. This claim is based on a 2022 Health Canada study titled « Health benefits per tonne of air pollutant emissions reduction ».

It can be read that each reduction of one ton of emissions would result in a saving of $340,000 to $520,000 in health-related expenses.


Distribution of declared pollutants
Distribution of a selection of declared pollutants in 2023

Mario Asselin
Vanier-Les Rivières
Responsible Member of Parliament for the company's constituency

Why send a message to your Member of Parliament?


Write to:

  • share your concerns.
  • find out if the company is exceeding provincial standards.
  • demonstrate your interest in health and air quality.
  • request an update on air quality issues.
  • know the elected official's plan to reduce air pollution.
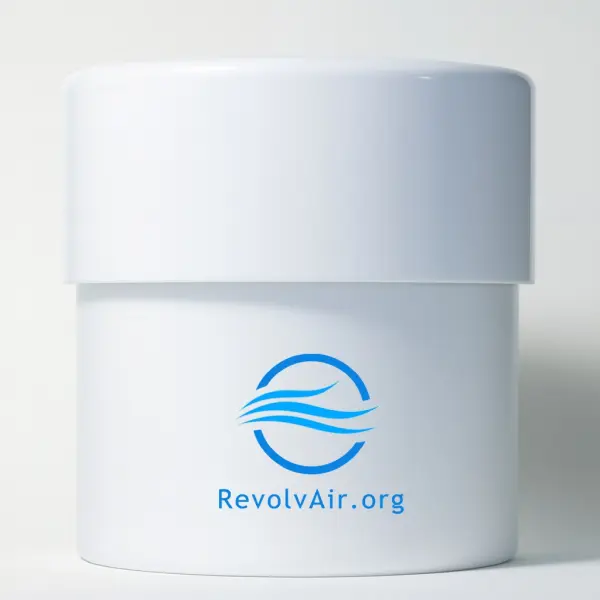
Would you like to measure pollutants emitted by the nearby industries?

Our air quality analysis station will allow you to know the quality of the air you and your family breathe in real time. You will also produce open scientific data for scientists and society to use, helping us fight for our right to clean air. Made in Québec!

Learn more

Air Pollution
Industry Air Pollutants
List of air pollutants created by the industry during the years

PM2.5 - Particulate Matter <= 2.5 Micrometers

0.63 tonnes in 2023
0 $ $ Benefit for the reduction of fine particles (PM 2.5)
+26.0 %
from 2022 to 2023

PM10 - Particulate Matter <= 10 Micrometers

1.21 tonnes in 2023
+0.8 %
from 2022 to 2023

Volatile Organic Compounds (VOCs)

10 tonnes in 2019
+1 328.6 %
from 2018 to 2019

Manganese (and its compounds)

0.017 tonnes in 2013
-15.0 %
from 2012 to 2013
Water Pollution
Industry Water Pollutants
List of water pollutants created by the industry during the years

No data found for this industry
Soil Pollution
Industry Soil Pollutants
List of pollutants contributing to the greenhouse effect

No data found for this industry
GES
Greenhouse Gases
List of pollutants contributing to the greenhouse effect

No data found for this industry

Pollution sources near you

Participate in our citizen science project by adding sources of air pollution near you. This project will allow us to create an accurate map and provide you with more precise analyses of air pollution issues. Thank you for your participation!

Yes, I want to participate

Would you like to measure pollutants emitted by the nearby industries?

Our air quality analysis station will allow you to know the quality of the air you and your family breathe in real time. You will also produce open scientific data for scientists and society to use, helping us fight for our right to clean air. Made in Québec!

Learn more